Mankind is at the center of our preoccupations at techso, it is why we enjoy having a good time all together. We have the habit of regularly feeding our social club with various and diverse activities.
The COVID came and completely destroyed our habit to reunite, may it be personally or internally at Techso. We then had the idea to challenge ourselves individually and collectively by organising a sport challenge !
Due to the creativity and the competences of our team, we developed a tool allowing us to count the points of the challenge.
- Our first sport challenge – internally at Techso.
We wanted to put in place a challenge that would incite us to find the motivation to practice a physically challenging activity after coming out of confinement and the winter. The idea was to propose a challenge in which anyone, anywhere doing any kind of sport would be able to join.
- Functional requirements
Our challenge format was as follows: build up two teams and count the total moving time of any kind of activity (Jogging, Biking, Skiing, Skating, Walking, Training, etc).
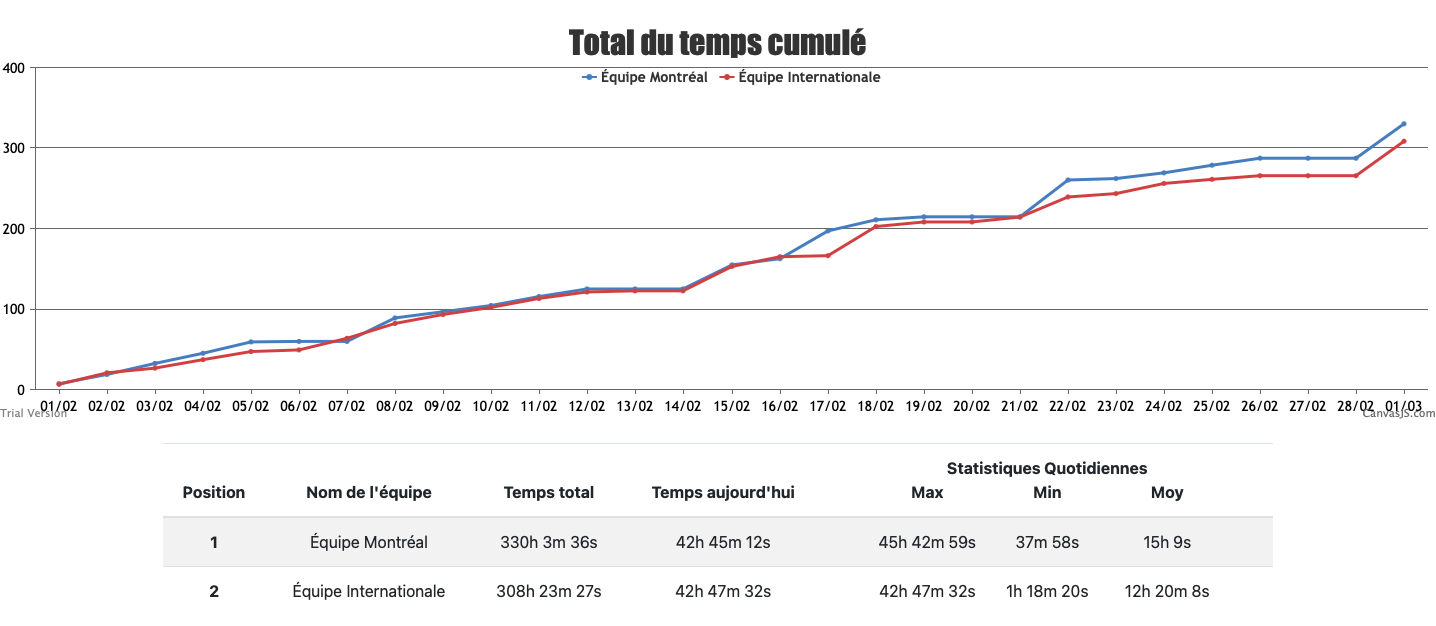
We wanted a tool allowing each participant to see the number of hours each team currently has. Concurrently, to allow the synchronization of everyone’s activities, we put in place a Strava group.
- Technical implementation
We required the challenge to start as soon as possible, to do so, we had to carefully choose our technologies for the backend, the web page and the database.
For the backend part, we selected Kotlin, notably for its interoperability with Java (compatible with every single library and line of code written in Java), but also for its flexibility, readability and its capacity to allow developers to avoid boiler-plate code. The backend allowed us to create teams, edit them, add time, calculate the points and integrate the public API of Strava using OAuth2 resulting from a user interaction on the web page.
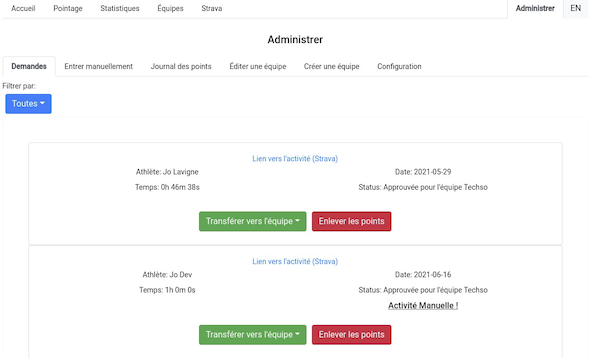
For the web part, we retained Angular 9. The backend is serving the static files required for the web page to work; and the latter allows us to see, using a chart, the progress of each team, but also to import the activities from Strava as an approbation request and administer them.
For the database part, MongoDB seemed the most interesting since it is possible, for the majority of the cases, to completely avoid writing migration files. It is also available on the cloud for free, allowing us to store up to 500 megabits of data and write data models swiftly.
Finally, we had to make the web application publically available with a public domain name to allow everyone to quickly access it. To do so, Heroku was deemed worthy, allowing the deployment of a web application for free, as long as we use less than 1000 hours of compute time each month. Heroku also provides us with a free domain name, in the format app-name.herokuapp.com.
2. Our second sports challenge – against Flinks
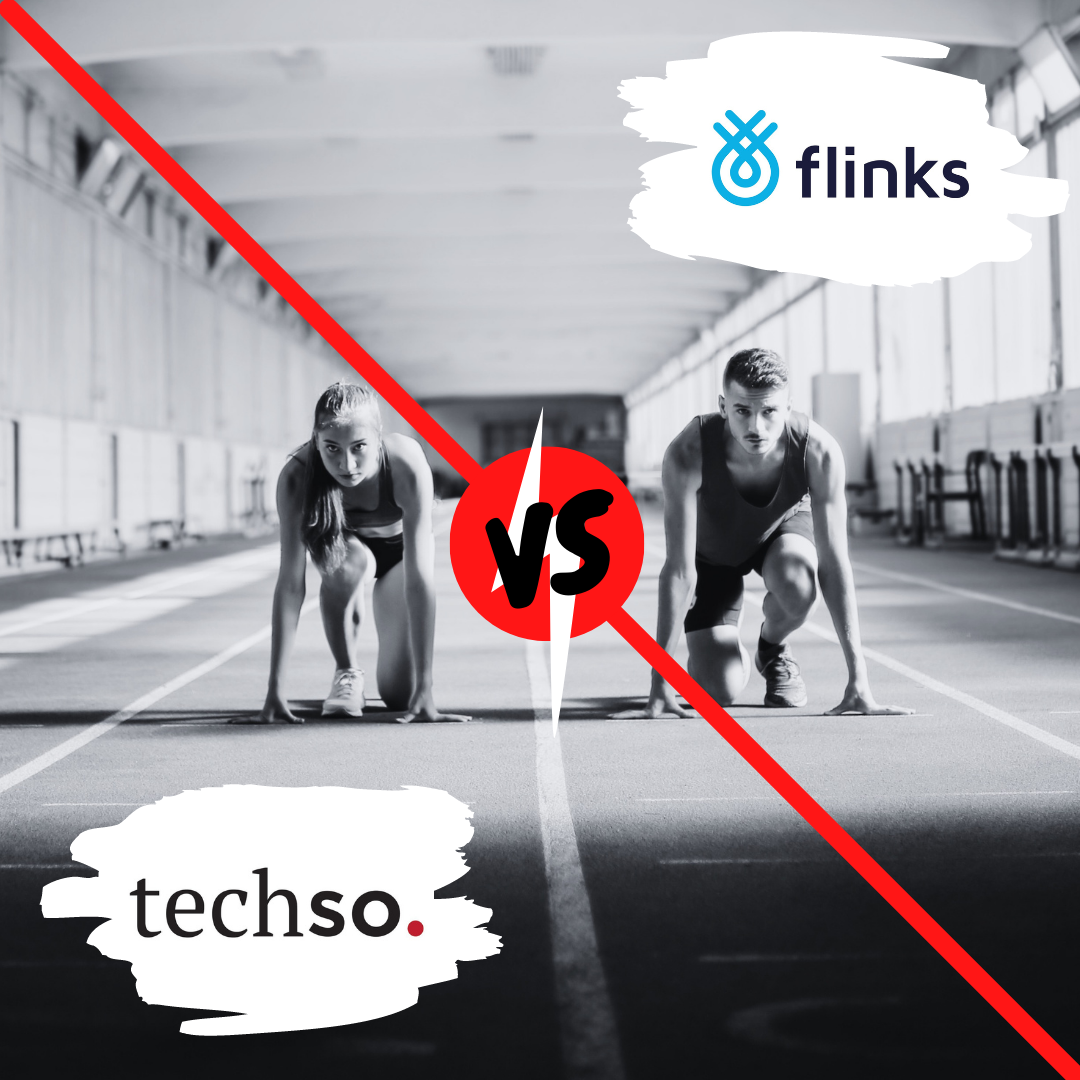
Following the huge success of our first edition, we definitely wanted to try again, but this time with a few changes by challenging another company: Flinks.
- Functional requirements
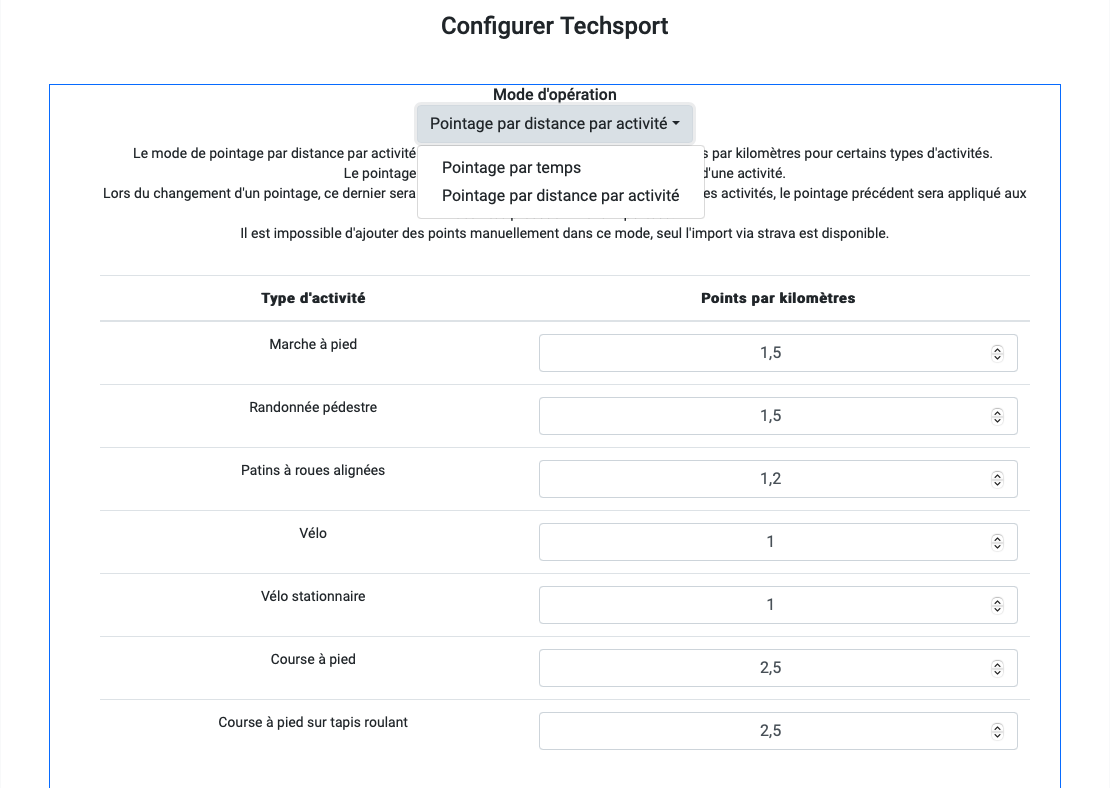
This time, we decided to add, no not hours, but distance in kilometres. This new specification constrained us to limit the supported sports by keeping only: running, biking, walking, hiking and inline skating. In order to be equitable, we thought about putting in place a new point system that would differ according to the sport (for instance, it is easier to do more kilometres using a bike than it is running).
The points were therefore added differently according to the sport:
- Running (Outside or on a treadmill): 2.5 points / km
- Walking and Hiking: 1.5 points / km
- Inline Skating: 1.2 points / km
- Biking (Outside or virtually): 1 point / km
We wanted the point attribution to be automatic according to the activity.
Just like the first edition, a Strava group was put in place for the same purposes: synchronize, save and visualize each and everyone’s activities.
- Technical implementation
Since the entire architecture is already built, all changes at this point were mostly on the development side. Each part of the stack was modified to fit the new requirements.
Three new data models were born in the database. The first one allows the configuration of the application, which until then was impossible. The second is used to store the user sessions to prevent users from having to login to Strava each and every time. This also allowed users to see the status of their approbation requests. The last one was a plus value since we created a new tab allowing us to visualize the statistics of each team according to each sport.

On the backend side, we had to take in consideration the new logic concerning the points. For the Strava part, there weren’t that many changes, it was complete to recover the data.
The most delicate part was to transform the time in hours into points according to the distance for each team, in the approbation requests that is. A few fields were added for that matter: notably the raw points with no modifiers (in this case the raw distance in kilometres), the applied rate (x2.5, x1.5, etc) according to the sport and the points total, calculated using the applied rate.
Thanks to these new fields, most changes on the web page were very small and purely visual, may it be on the scoreboard or the admin page. On the admin page, we were able to add an option to change the operating mode from time to points per kilometer and vice-versa.
We were able to solve the challenge of both editions, thanks to the participation and the implication of everyone, but also on the tooling level, making the competition that much more attractive and interesting. We are now ready for a third edition, who would dare challenge us ?
Annex of the technologies
- Heroku : https://www.heroku.com
- MongoCloud (database) : https://www.mongodb.com
- Kotlin vs java : https://kotlinlang.org/docs/comparison-to-java.html
- Angular (for the web page) : https://angular.io/
- Charts.js (for the scoreboard chart) : https://www.chartjs.org/